We use cookies on this site to enhance your experience.
By selecting “Accept” and continuing to use this website, you consent to the use of cookies.
Search for academic programs, residence, tours and events and more.
This report contains forward-looking information. In preparing the 2018/19 Budget report, certain assumptions and estimates were necessary. The assumptions and estimates are based on information available to management at the time of preparing the 2018/19 Budget. Readers and users of this financial information are cautioned that actual results may vary from the assumptions used in preparation of the Budget.
Budget forecasts and information regarding the 2018/19 Budget have been presented to the Finance and Investments (F&I) Committee throughout the past fiscal year. As changes in revenue and expenditure drivers occur during the year, updated projections will be presented to the Board of Governors. Prior to the Board of Governors receiving this final Budget, the draft Budget was presented to the Finance and Investments Committee at their March 22, 2018 meeting, which provided the opportunity to review and comment prior to the information being presented in this report. In addition, the draft Budget was presented to the Senate Finance Committee on March 21, 2018 and to Senate on April 17, 2018. At the Senate meeting, the motion was put forward from the Senate Finance Committee that Senate recommends the 2018/19 Budget for approval by the Board of Governors. Fee information, which is part of the assumptions included in this 2018/19 Budget report, has been included in a separate 2018/19 Fee Report and is being presented to the Board of Governors for approval at the April meeting. This 2018/19 Budget report is prepared annually and in a format consistent with previous years in order to enhance comparability. Included is detailed financial information along with various commentary and analysis. The following information is presented in this report along with the expected actions by the Board of Governors:
For Approval:
The 2018/19 Budget has been developed using the adopted Responsibility Centre Management (RCM) Budget model. Appendix II: Cost Driver Detailed Information is attached for reference.
Questions or further information regarding this report may be directed to the Director, Budgets and Planning.
The Operating Budget comprises the major annual revenues and expenditures of the University’s financial operations. Revenues from student tuition fees and government operating grants account for 92% of the total operating revenues. Faculty and staff salaries and benefits account for 75% of the total operating expenditures.
The 2018/19 Operating Budget shows forecasted total revenues of $300.5 million, an increase of $19.9 million, or 7.1%, over last year’s Budget. This reflects a tuition revenue increase of $18.3 million, or 11.6%, resulting from a combination of tuition rate and enrolment increases and an increase of $1.7 million in government operating grants mainly from incremental funding for graduate growth.
Total expenditures are forecasted at $301 million, an increase of $15.5 million, or 5%, over last year. This includes an increase of $8.0 million in total salaries and benefits and $7.5 million in non-salary increases primarily relating to an enhanced scholarship budget, foreign exchange costs in support of information technology and library acquisitions, Indigenization plan initiatives, Brantford YMCA operating funding, continued marketing funds to support recruitment, and renovations to the administrative building at 202 Regina as leased premises in the community are eliminated.
The 2018/19 excess of expenditures over revenues has produced a deficit of $0.5 million which represents a decrease of $4.4 million compared to the 2017/18 budgeted deficit of $4.9 million. This small deficit will be covered with repurposed appropriations from prior years yielding a balanced budget for 2018/19.
The Ancillary Budget includes the self-sustaining activities of Food Services, One Card, Conferences, Residences, Bookstore, Parking, Printing and Copying Services. In 2018/19, revenue for the ancillary enterprises overall is estimated to increase by 14% from $42.4 to $48.1 million and expenses are forecasted to increase by 8% from $41.2 million to $44.5 million. The budgeted net surplus, after appropriations, is expected to increase from $0.26 million in 2017/18 to $0.63 million in 2018/19.
The Real Estate Budget (as presented in Table 27) encompasses the operations of the Waterloo Ezra-Bricker apartments, a portfolio of houses acquired for land banking purposes, and the Brantford Market Square property. The Real Estate Budget will have a deficit in 2018/19 resulting, to a large extent, from the Market Square operations having tenant vacancies. In January 2018, operations for Market Square were taken in-house which eliminates third-party management fees. Real Estate continues to make a $70,000 annual contribution to the University operating fund.
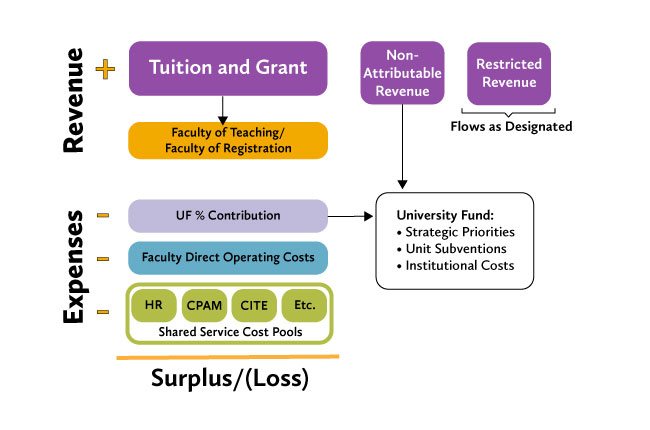
Laurier is in its second year of a Responsibility Centre Management (RCM) Budget model. The vision adopted for this new Budget model is:
“The RCM Budget model will support and enable Laurier’s institutional strategy and align financial responsibility and decision-making with academic and administrative priorities.”
The figure below illustrates the RCM structure (revenue minus expenses equals surplus or loss):

A Transition Plan has been developed outlining a five year timeline during which the Faculties will shift from their historical budget allocation to a budget allocation informed by their earned revenue, a key feature of an RCM Budget.
| Review | 2017/18 | 2018/19 | 2019/20 | 2020/21 | 2021/22 |
|---|---|---|---|---|---|
| Holdback | 90% | 85% | 60% | 30% | 0% |
| % of surplus holdback returned | 10% | 15% | 40% | 70% | 100% |
| Total | 100% | 100% | 100% | 100% | 100% |
Flowing the fifth year, a review of the budget model is recommended.